Pull up three different real estate sites for homes in Santa Barbara's Riviera district and you will get three different stories about what happened to prices there in the past year. One says the neighborhood is down 13 percent. Another, describing the exact same streets under the label "Lower Riviera," says the median sale price is $2,128,000, down 8 percent. A third page, from the same website, puts the Lower Riviera median at $2,525,000, down 10 percent. That is a swing of nearly $400,000 within a single portal's own data, for a neighborhood most buyers assume has one clean number attached to it.
None of these figures is wrong exactly. They are all measuring something real. But what they are measuring is a market too small to behave the way a headline percentage implies, and understanding why matters more than the number itself if you are trying to buy or sell on the hillside above downtown Santa Barbara.
Two Pages, One Neighborhood, a $397,000 Gap
Here is what the discrepancy looks like laid out side by side, pulled from the same data provider within weeks of each other:
| Snapshot | Reported Lower Riviera median | Year-over-year change | Days on market |
|---|---|---|---|
| Neighborhood overview page | $2,128,000 | down 8% | 27 days average |
| Recently-sold listings page | $2,525,000 | down 10% | 46 days average |
The median moved by almost 19 percent depending on which page you happened to land on, and the reported time on market nearly doubled between the two. Neither figure is fabricated. Each reflects a slightly different pull date and a slightly different slice of closed transactions. But if you are a seller deciding on a list price, or a buyer trying to figure out whether an asking price is generous or aggressive, the honest answer is that neither number should be treated as gospel on its own.
Why a 2,200-Home Neighborhood Can't Give You a Stable Median
The Riviera Association, the neighborhood's homeowners group, was established in 1930 and today represents roughly 2,200 homes across a roughly two-mile stretch of hillside threaded by Alameda Padre Serra, the neighborhood's main road. That sounds like a substantial community, and it is. But it is not a liquid one. A neighborhood of 2,200 homes does not produce enough annual closings for a median to smooth itself out the way it would in a tract of several thousand nearly identical houses changing hands every month.
When only a handful of Riviera properties close in a given quarter, the mix of what happened to sell, a renovated Spanish Colonial versus a dated ranch house needing work, a compact Lower Riviera cottage versus a large parcel near the top of the hill, moves the median far more than any actual shift in buyer demand. A steep drop in the reported number can mean the neighborhood cooled. It can just as easily mean that this particular quarter's sales skewed toward smaller or less updated homes than last year's did.
A median built on a few dozen transactions is not a thermometer. It is closer to a coin flip that happened to land the same way three times in a row.
What the Median Is Actually Pricing: The View, Not the Floor Plan
There is a second reason Riviera numbers resist easy comparison, and it has nothing to do with sample size. It has to do with what a dollar buys on that hillside versus what it buys three miles away.
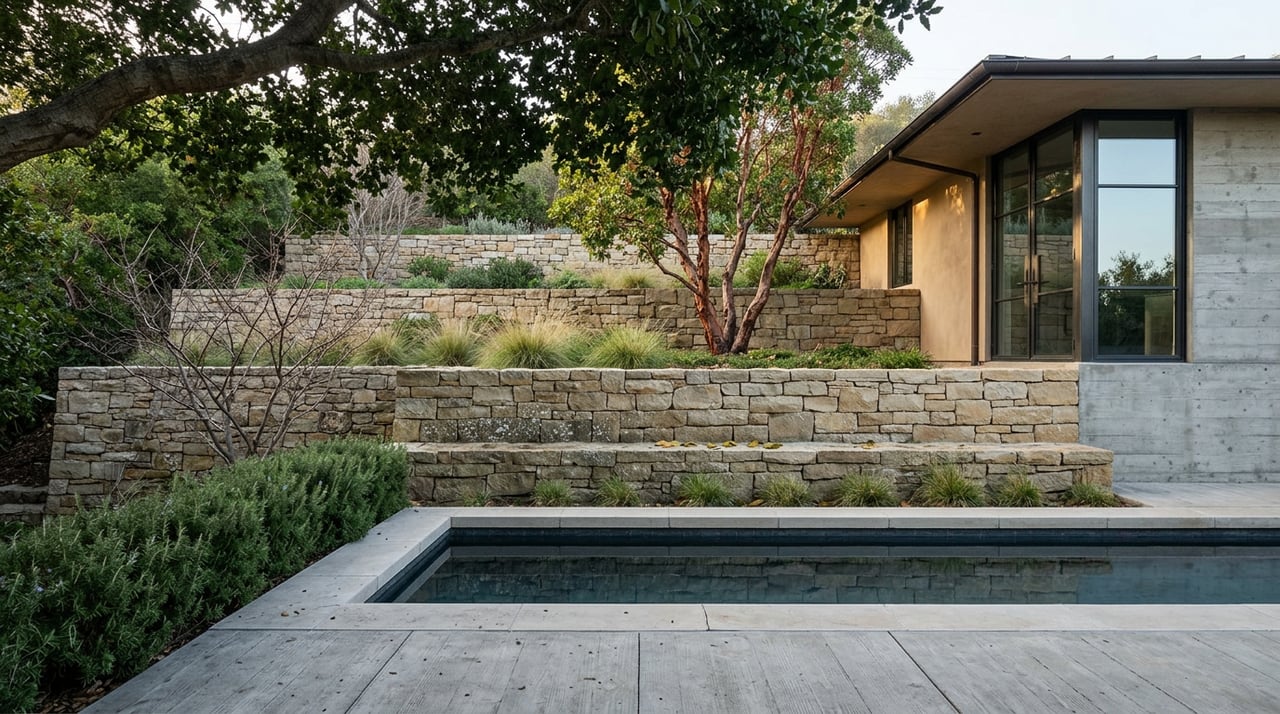
Single-family homes in the Riviera carry a median price around $3,713,600, compared with roughly $1,695,000 for single-family homes in downtown Santa Barbara, according to recent portal data. That is more than double the price in the same city, and a price-per-square-foot comparison alone will not explain it. Riviera lots are deliberately modest in size, not because land is cheap there but because the terrain and the view corridors that make the hillside desirable leave less room to build. The neighborhood took its current shape starting in 1913, when a group of investors began developing land whose earliest known residence dates back to 1872, and much of the hillside terracing and stonework that still lines its narrow roads was laid by Italian immigrant masons in the early twentieth century. Most of the homes standing today were built between 1950 and 1990, in a mix of Spanish Revival and Modernist styles, threaded along winding streets that were never designed for large flat building envelopes.
The result is that a Riviera buyer is not really purchasing square footage in the way a downtown or Mesa buyer is. They are purchasing an unobstructed sightline to the ocean, the harbor, or the Channel Islands, on a lot too steep and too narrow to have been platted any other way. A $/sqft comparison that works perfectly well for a flatland neighborhood will systematically undervalue or overvalue a Riviera property depending on which direction its windows face.
Upper and Lower Riviera Are Two Different Conversations
"The Riviera" also functions as an umbrella term for two areas that behave differently in practice. The upper section, near the Belmond El Encanto and Franceschi Park, holds some of the neighborhood's largest and oldest view lots. The lower section, situated above Milpas Street and closer to the Santa Barbara Bowl, tends toward smaller Craftsman and ranch-era lots with more frequent turnover. Both share the Riviera Theatre, built in 1926 and still home to the Santa Barbara International Film Festival, as a common landmark, along with Roosevelt Elementary School, Santa Barbara Junior High, and Marymount School, all located within the neighborhood's boundaries.
Treating "Riviera" as a single line item, the way a headline median does, flattens a real distinction between two submarkets with different housing stock, different typical lot sizes, and different pools of buyers. A seller in Lower Riviera pricing off an Upper Riviera comp, or the reverse, is comparing two different products that happen to share a name.
The City-Wide Version of the Same Trick
This is not a quirk unique to one hillside neighborhood. It shows up in the citywide numbers too. In May 2026, the average Santa Barbara sale price was up 2.9 percent year over year, while the median sale price for the three months ending that same month was down 9.1 percent. Same city, overlapping windows, opposite directions. The most straightforward explanation is a shift in the mix of what sold. May 2026 alone saw 176 closings compared with 147 the year before, and a broader pool of transactions almost always pulls in more variety at both ends of the price spectrum, which can drag a median down even as high-end sales keep the average climbing.
Zoom out further and the Santa Barbara Association of Realtors put the broader area's general median at $2,302,500 at year-end 2025, a figure that sits well below the Riviera's own submarket number and is itself just one more reference point rather than a ceiling or a floor. One 2026 market outlook for the area specifically flagged the Mesa and Riviera pocket as likely to stay tight on inventory, with move-in ready homes drawing multiple offers within about two weeks. A neighborhood does not behave like a softening market and a competitive one at the same time unless the headline percentage and the on-the-ground experience are describing two different things, which in the Riviera's case, they are.
What This Means If You're Pricing or Comping a Riviera Property
- Do not anchor a list price or an offer to a single portal's year-over-year percentage. Ask which window and which sales it is built from.
- Separate Upper Riviera comps from Lower Riviera comps. They are different products wearing the same neighborhood name.
- Weight view corridor and lot orientation more heavily than raw square footage when comparing two Riviera properties to each other.
- Watch days on market for well-prepared homes specifically, not the blended average. Redfin's own Riviera-specific data shows the broader market moving in around 49 days, while properties priced and presented well can go pending in roughly 26 days at close to 2 percent over list.
- If a headline number seems dramatic in either direction, ask how many actual closings it represents. In a 2,200-home hillside neighborhood, that count is often smaller than it looks.
FAQ
Is the Riviera actually getting cheaper? The honest answer is that no single reported percentage settles this. Different pages measuring the same twelve months have shown declines anywhere from 8 to 13 percent, largely because of how few transactions the neighborhood produces in a given window rather than a uniform drop in value.
Why do Upper and Lower Riviera prices differ so much under one neighborhood name? They hold genuinely different housing stock, lot sizes, and proximity to different landmarks, from the Belmond El Encanto and Franceschi Park at the top of the hill to the Santa Barbara Bowl near the bottom. Treating them as one market obscures more than it reveals.
Does a smaller Riviera lot mean a smaller price? Not necessarily. Because the hillside's value is tied closely to view corridors carved out by the 1913-era development pattern, a compact lot with an unobstructed ocean or island view can outprice a larger, flatter parcel elsewhere in the city.
If you are weighing a purchase or a sale on the Santa Barbara Riviera and want the comps read correctly before you commit to a number, the team at Dusty Baker Group can walk you through what the current data actually supports for your specific street and lot, not just the neighborhood-wide headline.